| Syed Junaid
After successfully completing the registration process of the plugin, If there are some errors then we need to debug a plugin to see what is causing the error.
To debug the plugin we have to follow the following steps:
-
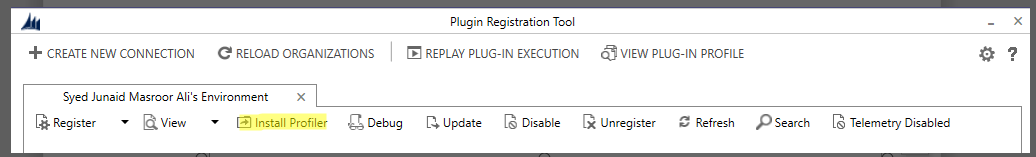
Go to the environment where the plugin is registered and install the plugin profiler.
-
After the installation, select the plugin step you want to debug and click on start profiling
and in the dialog select ok. This will start saving the profile.
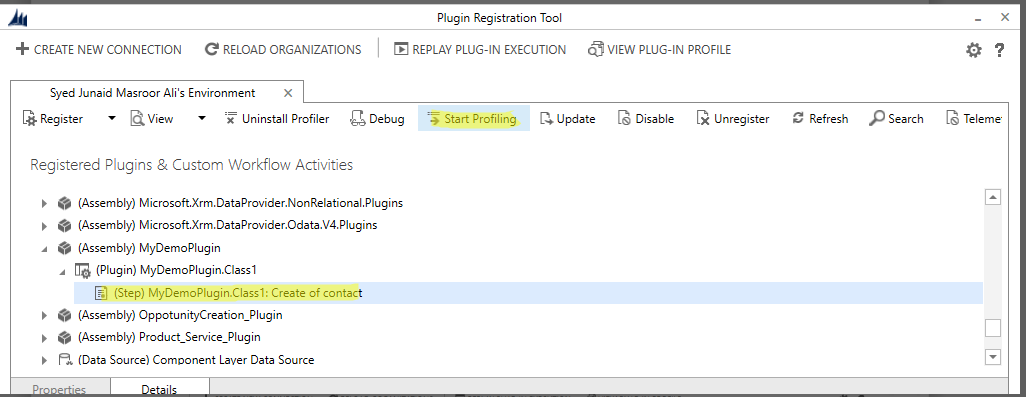
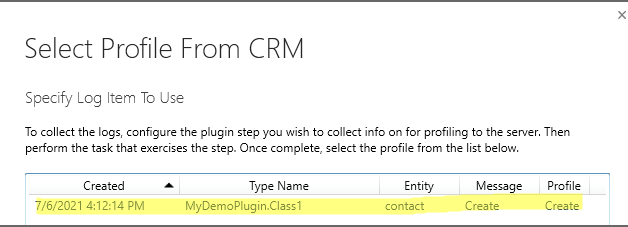
- Perform the step on which you have registered your plugin so that we can save that profile. In my case, creating the contact.
-
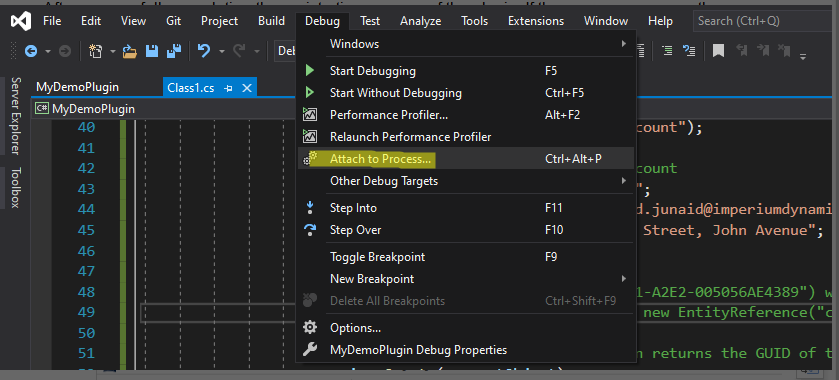
Go to your visual studio plugin project and attach the debugger to the Plugin Registration Tool
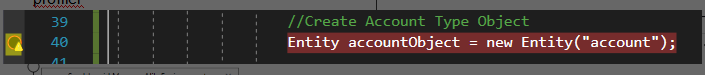
and put a breakpoint on a line from which you want to start your debugger.

-
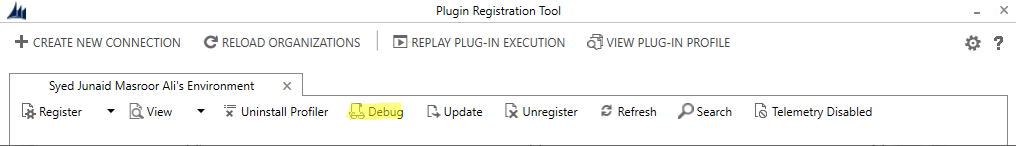
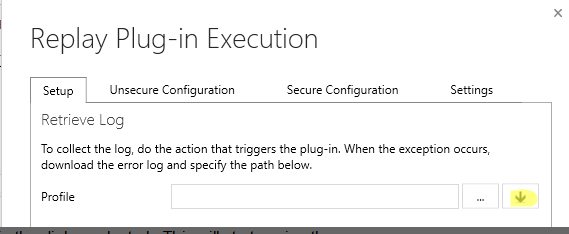
Go to your plugin registration tool, select debug. After that select the profile on which you
want to debug.
-
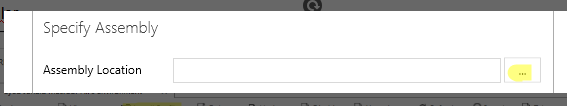
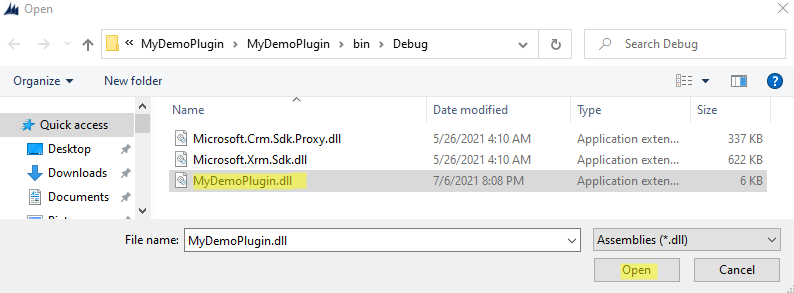
Then select the assembly of your plugin (.dll)
-
Click on start execution.
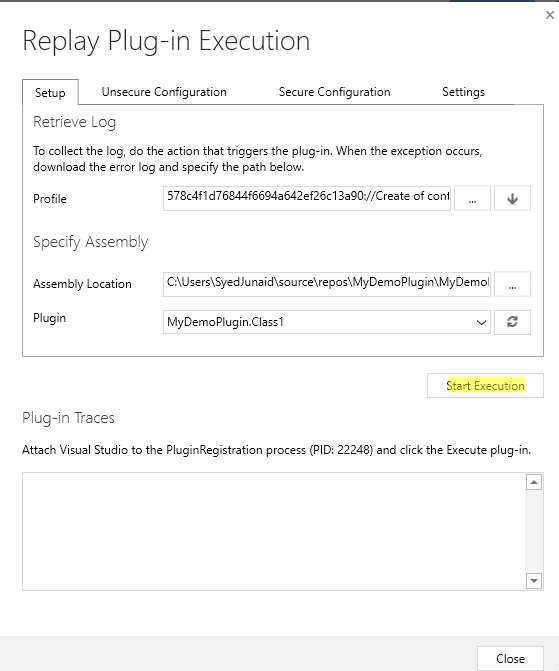
It will start the debugging process on the selected profile. You can go to Visual Studio and debug the whole code in order to see what is causing the error.
Click here to learn more about Imperium's Dynamics Services.