| Aqsa Nabi
Dynamics Dashboards have a vast category of creating dashboards, that can be used widely for analysis of data and report management as well. With the help of custom views and charts, organizations can create multiple ways to maintain in-depth insights into the data running across their platforms.
Create Custom Views
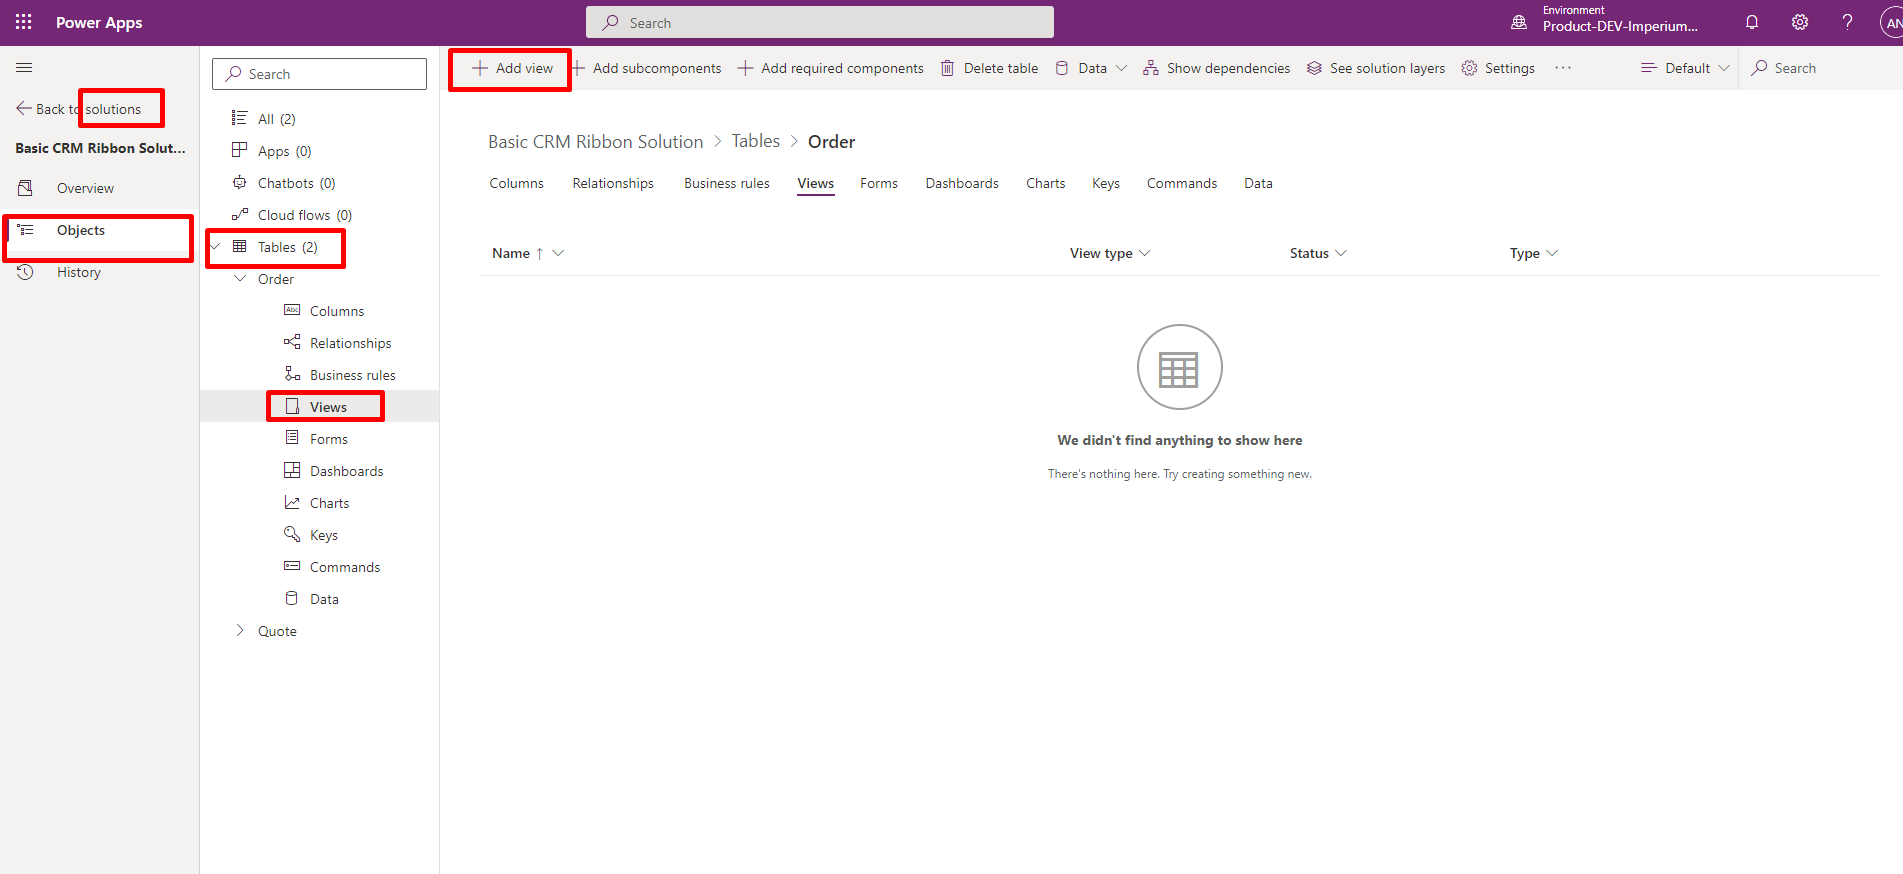
To create a custom dashboard, navigate to the Solutions from the left pane, select the Solution you want to create a view for, navigate to Objects and select the Table of the solution, here click the tab ‘Views’. Click ‘Add View’ to create a custom view. The custom view helps in knowing which fields should be part of displaying charts in the final dashboard. The view creation is a simple yet crucial step, where the Name of the view is the title of the chart. Select fields of interest in the views and apply advanced filtering to view field data based on logic.

Once the view has been completed, save, and publish the view. Make sure to click the ‘Publish’ button or else the view will not be available when creating a chart.
Create Custom Charts
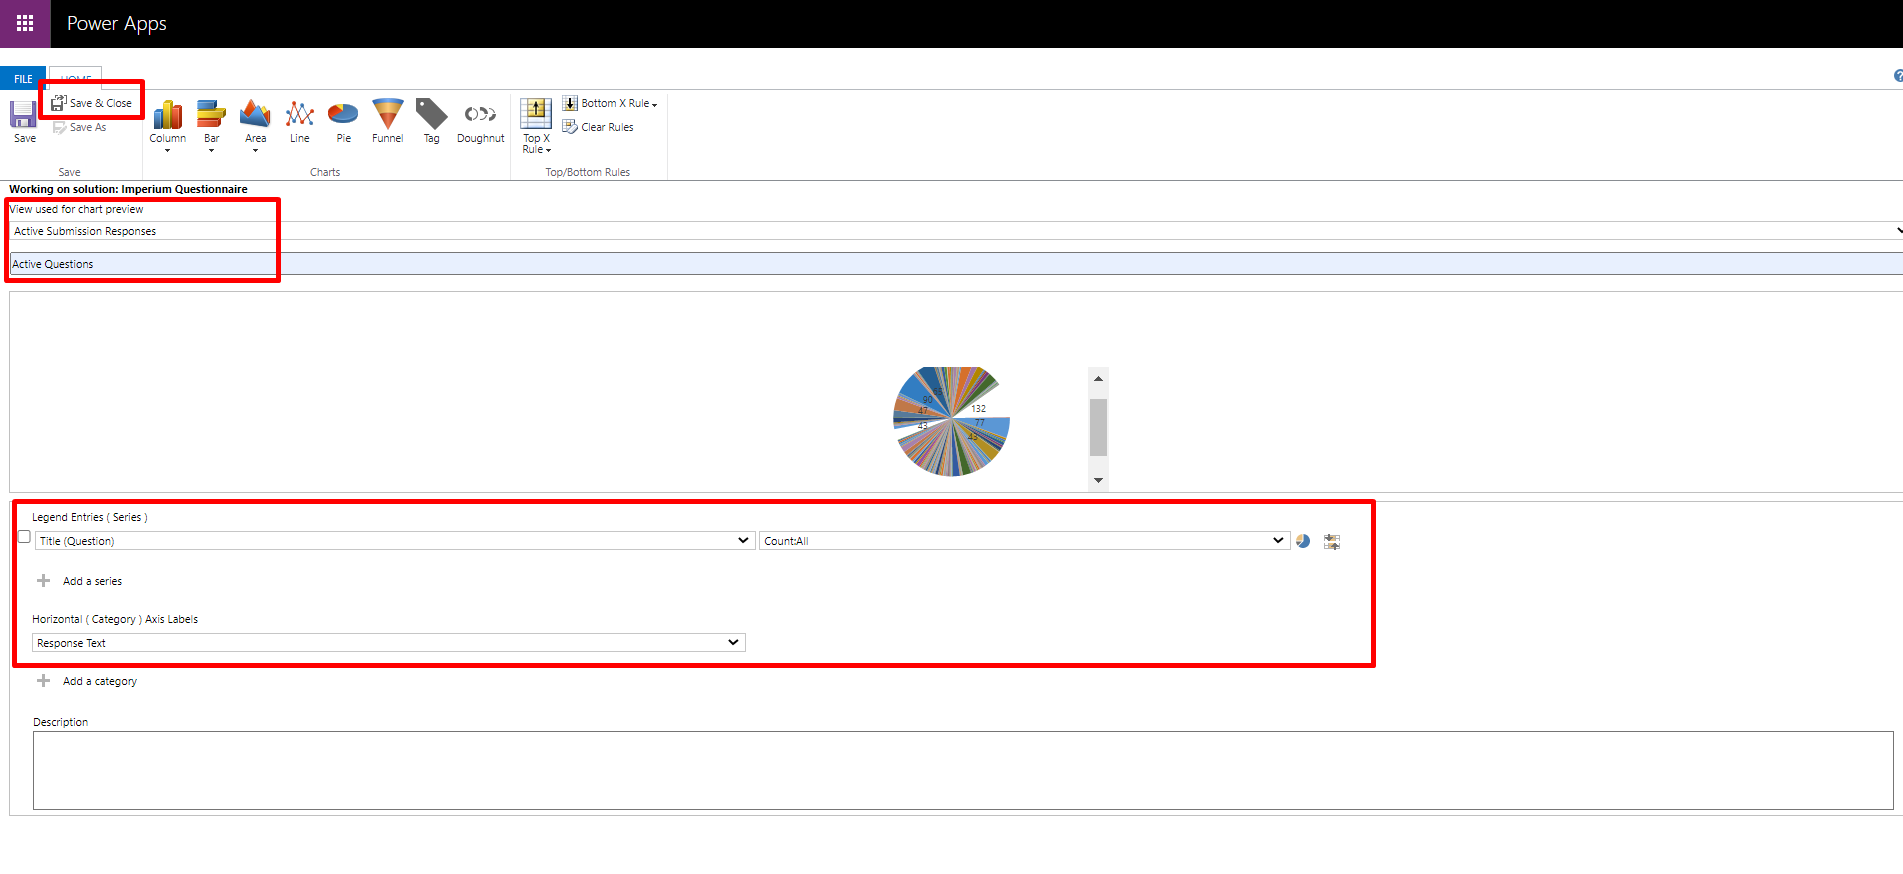
Navigate back to the tables and click Charts. Create a new chart that opens a new window. Here you can select the view from the lookup of all the saved views in the system. Pick the view, and then give a name to your chart that you wish to display as a sub-title on the main model-driven application.
Choose one of the charts from the options in the header and select the fields that you would like to show in the x-axis and y-axis. When the chart configuration is completed, click Save & Close button.

This will create a chart that will exist in the solution, and you can make changes to the charts whenever you like. If you make any changes to the view, it will be reflected in the chart as well.
Join us next time, as we continue our journey of learning canvas apps.Click here to learn more about Imperium's Power Apps Services. We hope this information was useful, and we look forward to sharing more insights into the Power Platform world.

