
TLDR Summary
Many organizations invest in Microsoft 365 Copilot but struggle to determine whether their users are adopting it effectively or realizing measurable business value. Simply assigning licenses is not enough. Organizations need a structured approach to track active usage, understand adoption trends, identify underutilized licenses, and quantify business outcomes.
A Copilot Consumption Calculator provides a practical framework for measuring utilization, engagement, productivity gains, and return on investment (ROI). By combining Copilot Analytics, usage reporting, and business-specific KPIs, organizations can move beyond basic license tracking and establish a data-driven AI adoption strategy.
When coupled with governance, executive sponsorship, and role-based enablement programs, consumption tracking helps organizations maximize their Copilot investment, improve productivity, and continuously optimize AI adoption across business units.
Product Area:
Microsoft 365 Copilot / Copilot Analytics / AI Adoption & Governance / Productivity Transformation
Tags / Keywords:
Microsoft 365 Copilot, Copilot Consumption, Copilot Adoption, AI Governance, Copilot Analytics, Consumption Calculator, Microsoft AI, AI ROI, Productivity Analytics, Microsoft 365 Administration, Copilot Reporting, AI Transformation, Executive Dashboards, Adoption Framework
1. Context & Problem Statement
Organizations are investing in Microsoft 365 Copilot to increase productivity, automate repetitive tasks, and help employees work faster across Microsoft 365 apps. However, many teams encounter the same post-deployment challenge: how do we measure whether Copilot is being consumed effectively and delivering value?
Simply purchasing licenses does not guarantee adoption. Without a measurable consumption strategy, organizations may see inconsistent usage, poor visibility into active users, and difficulty proving return on investment.
What business or technical problem does this solve?
Understand how Copilot usage and consumption should be measured.
Identify key adoption metrics and usage patterns.
Track AI utilization across departments and user personas.
Estimate and forecast consumption through a structured Consumption Calculator.
Optimize license utilization and maximize business value.
Why is this important?
Who is actively using Copilot.
Which workloads generate the highest value.
Where adoption is lagging.
Potential licensing optimization opportunities.
Business outcomes resulting from AI-assisted work.
Personas affected
Microsoft 365 administrators
IT decision makers
AI governance teams
Enterprise architects
Digital transformation leaders
Department managers
Business analysts
Adoption champions
Problem Statement: Before a structured consumption approach, many organizations rely on anecdotal feedback and license counts. They lack standardized usage measurement, consumption forecasting, department-level reporting, ROI visibility, and adoption benchmarking.
2. Architecture & Setup Overview
A Copilot consumption tracking solution combines Microsoft 365 usage data, analytics, a calculator model, and executive reporting. The goal is to make adoption measurable and actionable.

Figure 1. High-level Copilot consumption measurement flow
Key components
Microsoft 365 Copilot: AI assistance embedded in Word, Excel, PowerPoint, Outlook, Teams, and Microsoft 365 Chat.
Copilot Dashboard: Visibility into active users, usage trends, engagement patterns, and adoption insights.
Consumption Calculator: A structured model to calculate utilization, average engagement, estimated productivity gains, and ROI indicators.
Power BI (optional): Used for executive dashboards, department-level reporting, and recurring review packs.
Prerequisites
Microsoft 365 Copilot licenses assigned to pilot or production users.
Access to appropriate Microsoft 365 admin and reporting roles.
Defined adoption goals and success metrics.
Executive sponsorship and business-owner participation.
A baseline inventory of licensed users and target departments.
3. Step-by-Step Implementation
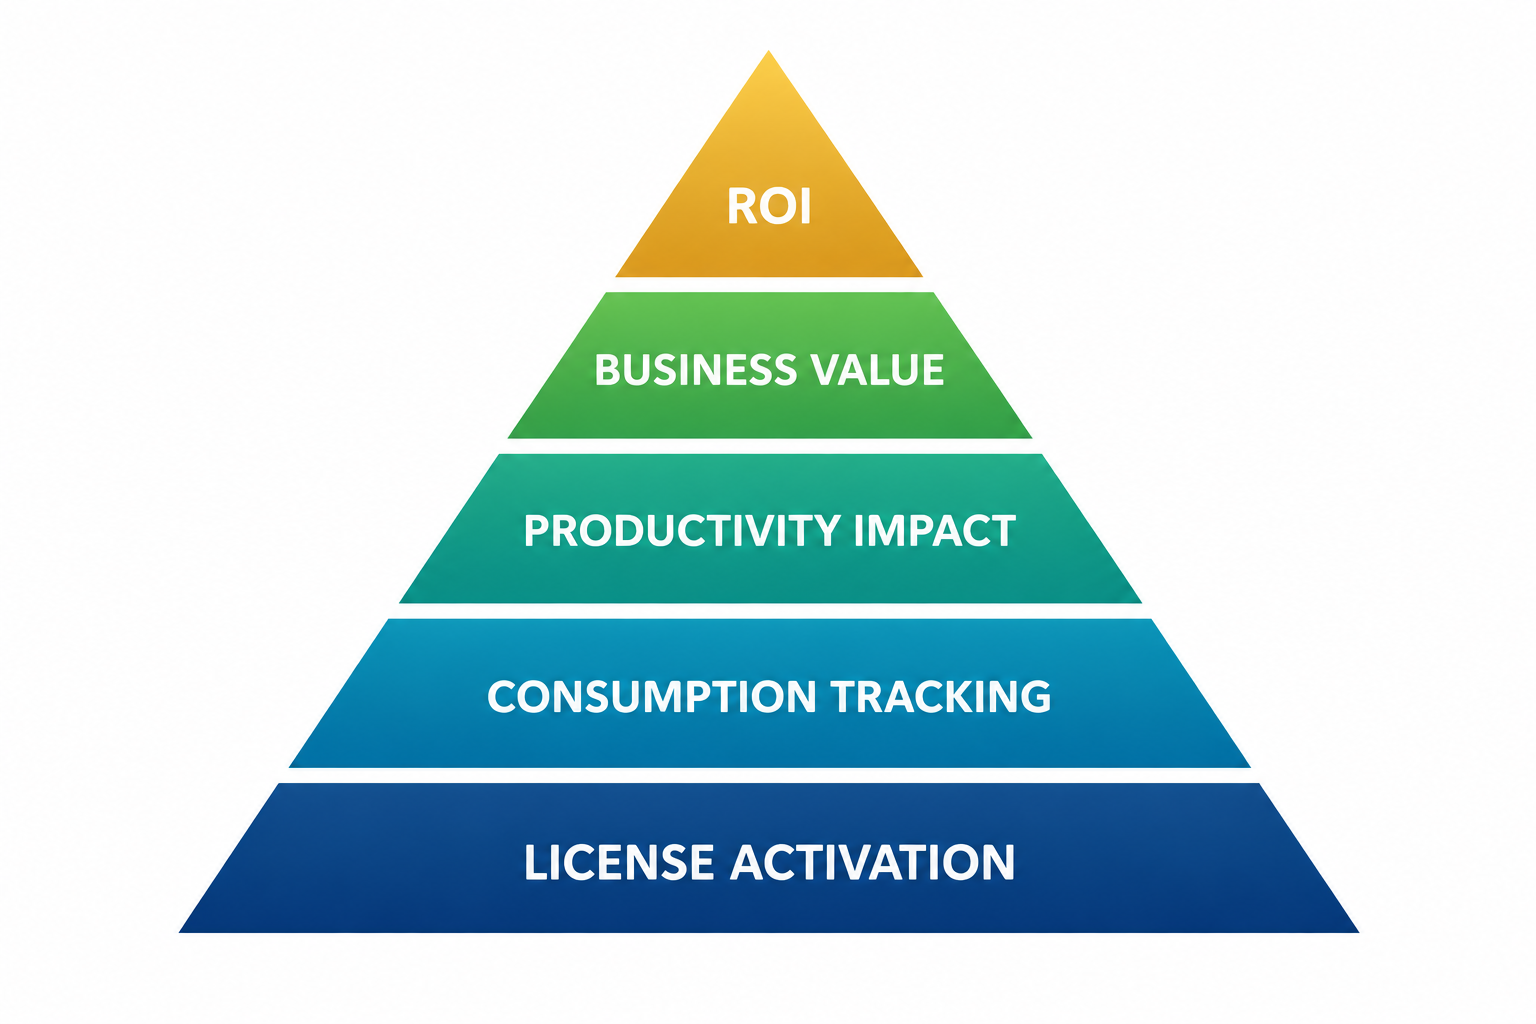
Figure 2. Copilot Adoption Maturity Model: Organizations progress from license activation to measurable ROI through consumption tracking, productivity improvement, and business value realization.
Step 1: Define success metrics
Begin by agreeing on how success will be measured. Consumption metrics should reflect both adoption behavior and business impact.
| Metric | Example Goal |
|---|---|
| Active Users | 80% monthly adoption |
| Weekly Usage | Minimum 3 Copilot interactions per week |
| Department Coverage | 90% of priority departments represented |
| Productivity Savings | 2+ hours saved per user weekly |
Step 2: Access Copilot Analytics
Navigate to Microsoft 365 Admin Center → Reports → Usage → Copilot Dashboard. Review active users, feature usage, workload usage, and adoption trends. Capture baseline metrics before running enablement campaigns, so improvements can be measured over time.
Step 3: Build a Consumption Calculator
Build the calculator in Excel or Power BI using the following core inputs.
| Input | Description |
|---|---|
| Licensed Users | Total assigned Copilot licenses |
| Active Users | Users interacting with Copilot during the measurement period |
| Daily Prompts | Average Copilot prompts or interactions |
| Weekly Usage Frequency | Number of active days per user per week |
| Estimated Time Saved | Estimated productivity improvement from Copilot-assisted work |
Sample formula — License Utilization (%): Active Users ÷ Licensed Users × 100
Example: 420 active users ÷ 500 licensed users × 100 = 84% utilization
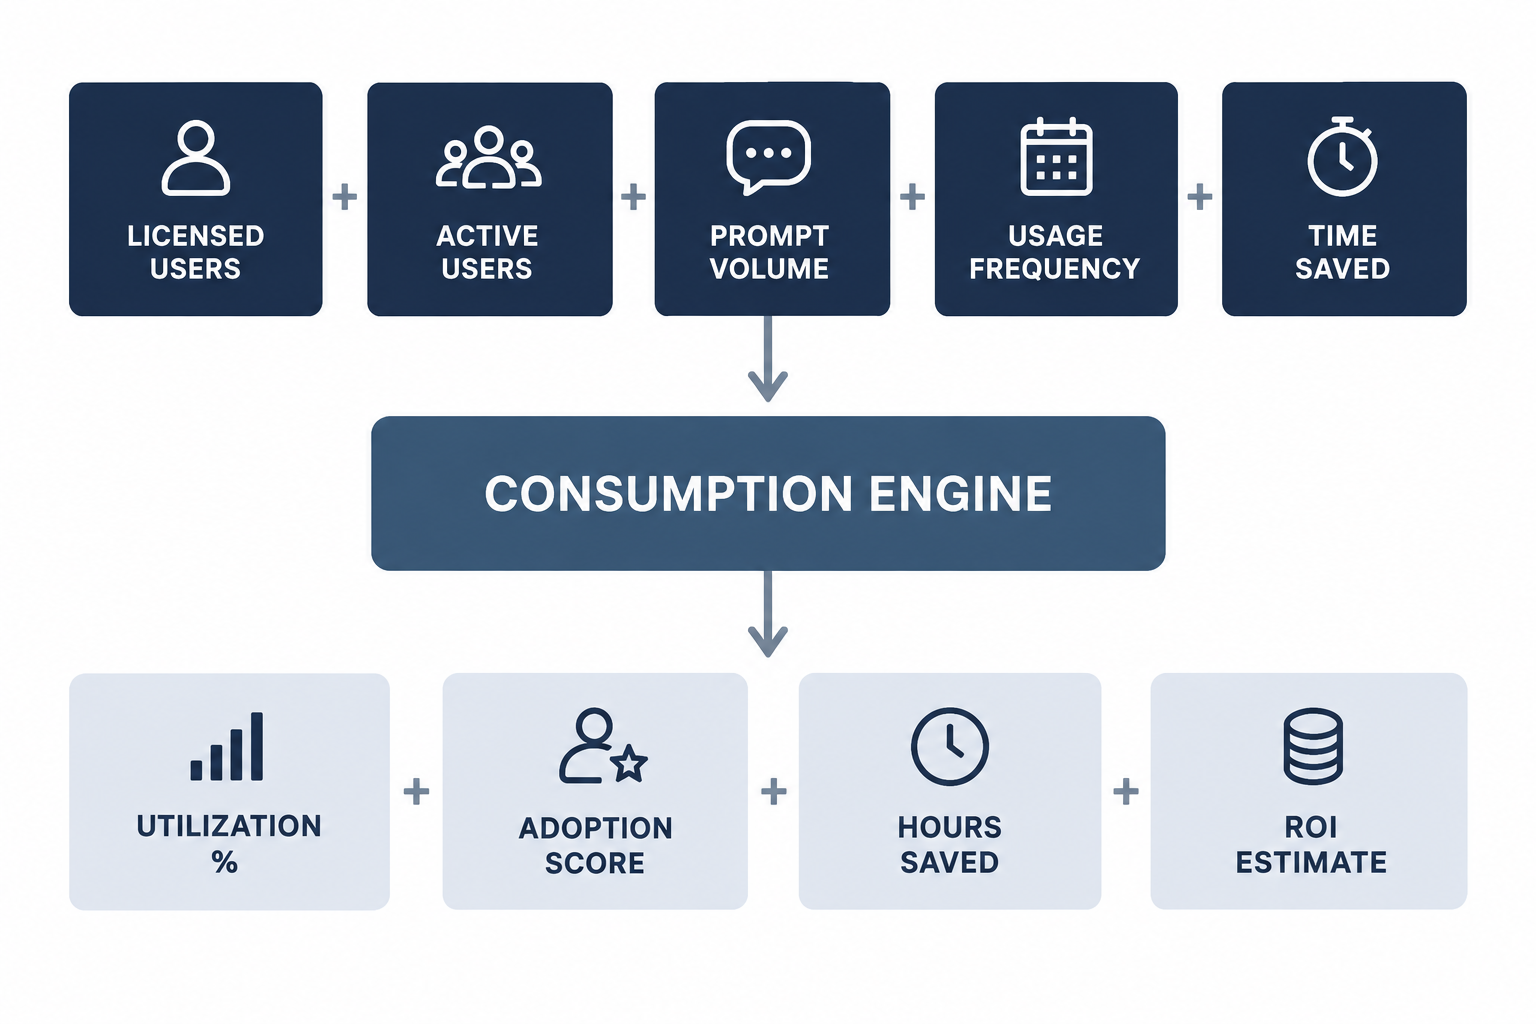
Figure 3. Core inputs and outputs of a Copilot Consumption Calculator.
Step 4: Calculate an adoption score
A weighted score makes it easier to compare adoption across departments or business units.
| Category | Weight |
|---|---|
| Active Usage | 40% |
| Weekly Engagement | 30% |
| Department Coverage | 15% |
| Feature Diversity | 15% |
Adoption score formula: Adoption Score = (Active Usage × 0.40) + (Weekly Engagement × 0.30) + (Department Coverage × 0.15) + (Feature Diversity × 0.15)
Step 5: Identify low-adoption areas
Departments with low activity.
Users with inactive licenses.
Underutilized Copilot workloads.
Teams requiring additional training or role-based prompt examples.
Step 6: Measure business impact
Reduced meeting preparation time.
Faster document creation.
Improved email drafting efficiency.
Reduced manual administrative work.
Better insight generation from meetings, documents, and data.
Step 7: Review monthly and optimize
Review consumption metrics.
Compare results against adoption targets.
Identify low-utilization licenses.
Launch enablement campaigns.
Update executive dashboards and business-owner actions.
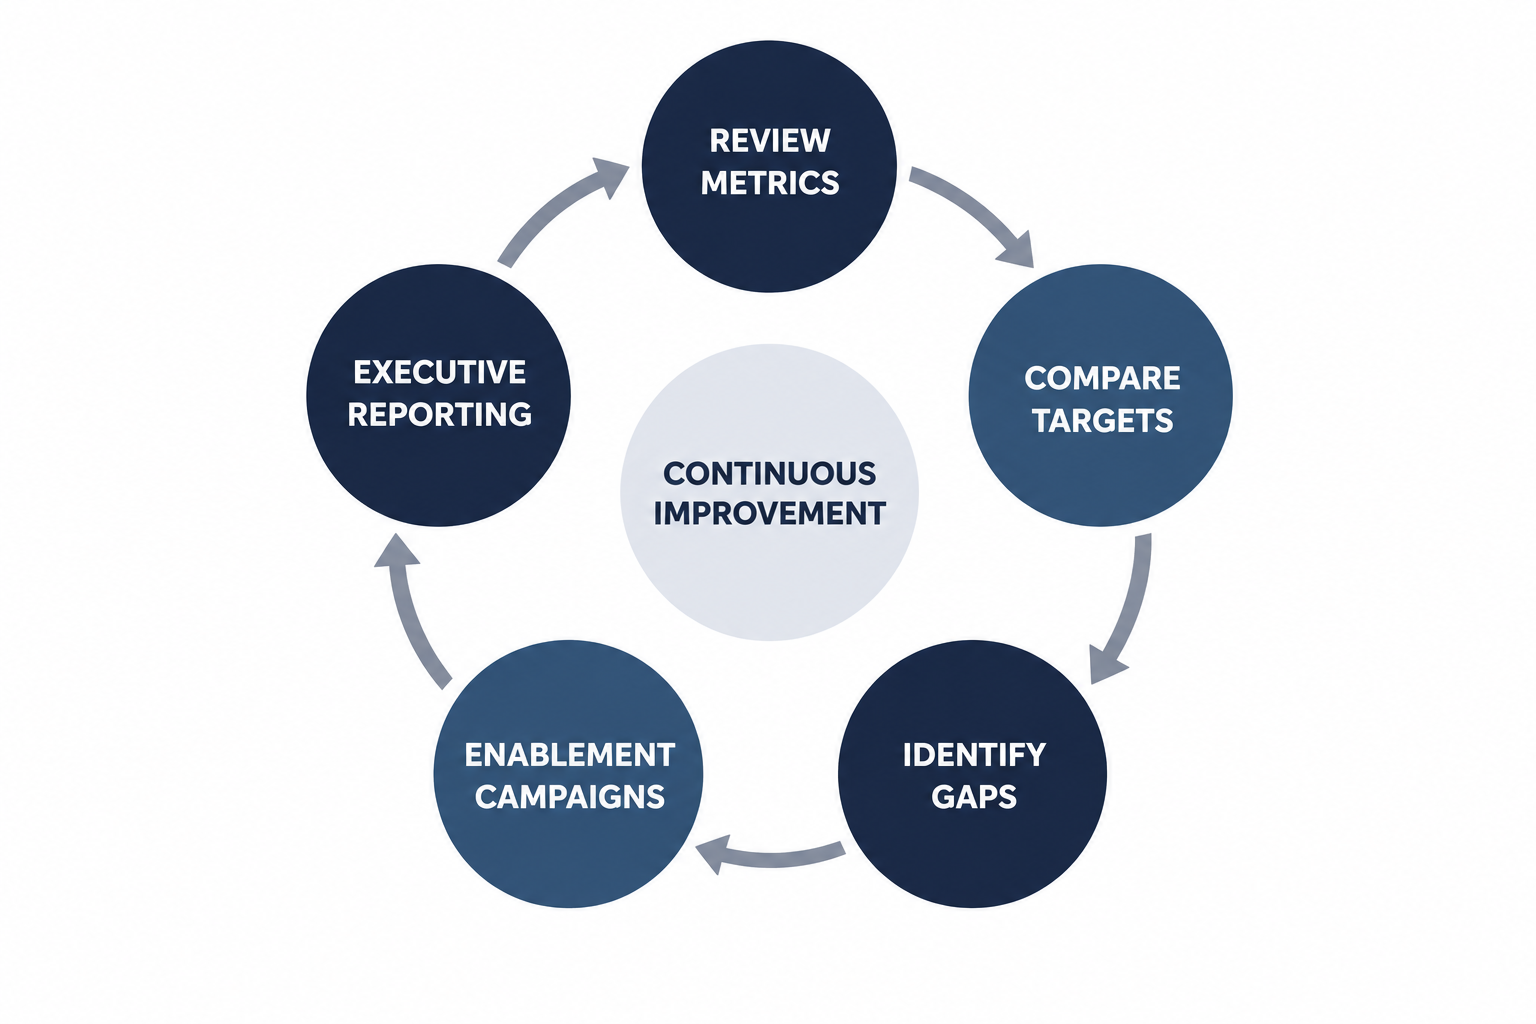
Figure 4: Monthly governance cycle used to sustain Copilot adoption and optimization.
4. Limitations & Best Practices
Known limitations
Usage does not equal value: High prompt volume does not automatically mean measurable productivity improvement.
Different roles consume differently: Executives, analysts, sellers, service teams, and operations users may need different benchmarks.
Adoption takes time: Most organizations should expect adoption to mature through awareness, training, scenario mapping, and governance cadence.
Best practices
Start with a pilot group: Select cross-functional champions who can provide feedback and demonstrate realistic use cases.
Focus on business scenarios: Track outcomes such as time saved, faster drafting, meeting summary reuse, and improved decision preparation.
Develop role-based prompt libraries: Provide examples tailored to HR, finance, distribution, operations, customer service, and leadership.
Create executive dashboards: Show adoption rates, consumption trends, business impact, and ROI indicators in a concise format.
Establish governance early: Define responsible AI principles, security expectations, acceptable use, and review ownership.
Common mistakes to avoid
| Avoid | Do Instead |
|---|---|
| Measuring assigned licenses only | Measure active usage and meaningful outcomes |
| Focusing only on prompt volume | Tie consumption to business scenarios and productivity gains |
| Providing generic training | Use role-based enablement and prompt libraries |
| Ignoring low-adoption departments | Review adoption by department and intervene with targeted support |
5. Real-World Example
A global professional services organization deployed Microsoft 365 Copilot to approximately 1,000 users across consulting, finance, and operations teams. Leadership wanted to understand whether users were realizing value from the investment and where additional enablement was required.
Solution implemented
Designed a Copilot adoption framework.
Built a Power BI Consumption Calculator.
Established monthly governance reviews.
Created department-specific prompt libraries.
Defined productivity KPIs for executive reporting.
Results
Increased visibility into Copilot usage across key departments.
Improved license utilization tracking.
Faster identification of adoption gaps.
Better alignment between AI investment and business outcomes.
Clearer recommendations for enablement campaigns and governance actions.
6. Key Takeaways & Resources
Key takeaways
Copilot success should be measured through both adoption and business impact.
Consumption calculators provide a structured way to track usage and value realization.
Active users are a stronger indicator than assigned licenses alone.
Role-based enablement significantly improves adoption.
Monthly governance reviews help sustain long-term success.
Recommended Microsoft resources
Appendix
Suggested consumption calculator fields
| Category | Example Measure |
|---|---|
| Licensing | Licensed Users |
| Adoption | Active Users |
| Engagement | Prompts per Week |
| Productivity | Hours Saved |
| Value | Estimated ROI |
| Governance | Compliance Score |
Version notes
Microsoft 365 Copilot
Current Copilot Analytics Dashboard
Power BI reporting integration
Example Copilot prompts
For adoption leads: “Summarize Copilot usage trends for the last 30 days and identify departments with declining adoption.”
For managers: “Create an executive summary of Copilot adoption and recommend actions to improve engagement.”
For IT administrators: “Analyze active versus licensed Copilot users and identify underutilized licenses.”

Emad Tariq |

Posted on: 12 October 2026